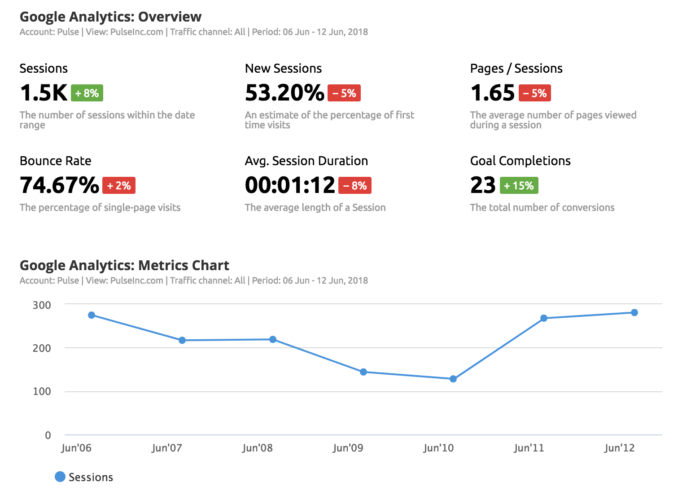
You can send weekly emails and have multiple conference calls, but until your client reporting shows graphs of impressions, clicks, and conversions, it can be difficult for them to see the value in your work. Show them what you’re worth.
A 2014 study from Farmers Insurance University found that nearly all advertising and marketing executives (98%) say that the best work comes when clients trust their agencies, collaborate (94% agencies, 100% clients) and maintain long-standing relationships (84% agencies, 81% clients). Transparent client reporting is one of the biggest factors in a successful client-agency relationship.
The 4 Qualities of a Successful Report
- Summarize important points on the first page
- Only talk about important data
- Avoid marketing jargon that will confuse the client
- Include recommendations
Essential Parts of Client Reporting
Overall Traffic
Organic Traffic: It’s easy to get caught up in the idea of paid media. The wonders of SEO can get lost in boosting Facebook and Instagram ads and posts.
Bounce rate: Getting visitors to the client’s site is one thing. Getting them to stay is another. Showing the client the bounce rate of visitors helps determine where you can work together for a better user experience (UX).
New vs returning users: Most companies aim for a 50/50 split of new and returning customers. They will be happy to see how their company is shaping up to achieving that goal.
Page load time: This correlates with the bounce rate of your visitor. By showing the client these numbers, you can encourage the client to look into backend issues that may cause a slow page load time.
SEO & Organic
Visits from organic: These figures are especially important if the client has ads running, too. They will like to see which method is bringing in more traffic, so they know if they can cut back on ad spend or if they need to increase it.
Where is organic traffic coming from? Along with the volume of organic traffic, it’s important to break down the sources. Whether that be Google, Facebook, Twitter, emails, etc.
Conversions from organic: How many organic visitors are actually signing up, buying the product etc? Compare these figures to conversions from paid traffic to show the client the importance of organic traffic or paid traffic – depending on performance.
Device type: Are visitors mostly viewing on a mobile device or desktop computer? This insight can help decide which you should optimize your site for. If you see a higher bounce rate on mobile devices, one could assume that the site isn’t optimized for the mobile setting.
Average visit time: Similar to a bounce rate, this tracks the total time the visitor spends on the client’s domain. The longer the visit time, the more likely you are to see a conversion.
Entries per landing pages: This explains which organic post is creating the most traffic. That recipe you posted last week? 50 clicks. The quiz you shared? 500 clicks. Once you take note of the differences, dig deeper and think about what one landing page has that the other one doesn’t.
Revenue: Clicks are great. Conversions are better. Generate this graph to show the client how your work is helping their business. If it’s not on a steady incline, think about what you, as an agency, can do to increase the company’s revenue.
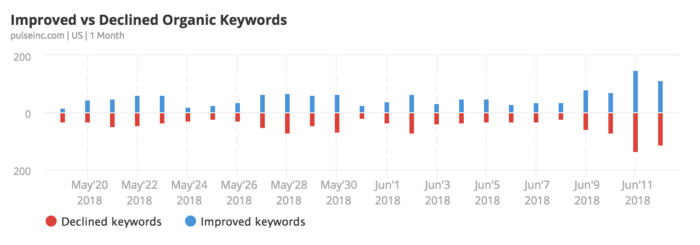
Keywords: Find out which keywords your client is ranking highest for and optimize a page for each one.
Backlinks
External links: Hard to get but helpful to have. Backlinks essentially serve as free ads. Your clients will LOVE to see this and the traffic they generate. Ideally, your report will show your backlinks, the site that linked to you, the number of clicks and the conversion rate from the links.
Insights/Recommendations
Let the client know what you have done for them since your last meeting and what you will work on until your next meeting. Obviously, emails and phone calls are available in between, but, this way, you can all be on the same page. This planning step also lets the client give you suggestions on what to focus on most.
Our Favorite Reporting Programs
All of these programs can do essentially the same thing, with different styles and different methods of reporting (PDF, JPG, PPT).
ReportGarden
This is our go-to. It lets you create templates, and then automatically imports the data from the given web applications (Google AdWords or Analytics, etc). You can use data from many different sources all in one report. It lets you drag each element around to rearrange the order.
SEMRush
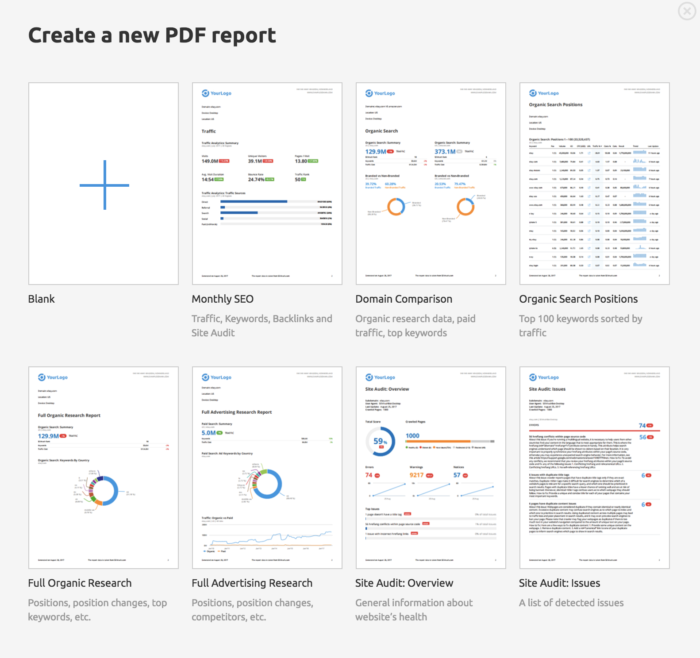
We use this platform to keep an eye on our clients’ sites on a regular basis. There is a reporting feature integrated into the site, though, that can compile all the data in an easy-to-read format. There are seven templates to choose from, or you can create your own report.
Moral of the Story
Agencies, be transparent with your clients.
Clients, ask questions of your agency.
Communication is the key to success.
Want more tips on client reporting and relationships? Shoot us a message.
Happy collaborating!


